


Design by: Ryan Nemeth
WRITTEN BY: Ryan Nemeth
Tides are defined by the alternate up and down movement of the water levels in the ocean that usually occur twice a day in a particular place as a result of gravity. These somewhat predictable swells are the result of the gravitational pull and the gravitational interaction between the Sun, the Moon and the Earth’s ocean. Based on the number of high and low tides and their relative heights each tidal day, tides are described as semi-diurnal, mixed, or diurnal. When the moon is directly over the Earth's equator, its associated tidal bulges are centered on the equator. In theory, all locations on the planet except those at the highest latitudes rotate through the two tidal bulges and experience two equal high tides and two equal low tides per tidal day; this is known as a semi-diurnal tide. Semi-diurnal tides have a period of 12 hrs and 25 min, and theoretically have a wavelength of more than half the circumference of Earth.
Different types of tides occur when the moon is either North or South of the equator. When the moon is above the Tropic of Cancer or Tropic of Capricorn, the diurnal inequality is at its maximum and the tides are called Tropic Tides. When the moon is above or nearly above the equator, the diurnal inequality is minimum and the tides are known as Equatorial Tides. Whereas Semidiurnal tides are observed at the equator at all times, most locations North or South of the equator experience two unequal high tides and two unequal low tides per tidal day; this is called a mixed tide and the difference in height between successive high (or low) tides is called the diurnal inequality. Notably, points at high latitudes are often impacted by only one tidal bulge and experience one high tide and one low tide per tidal day. When this occurs, this singular Diurnal tide has a period of 24 hrs and 50 min.
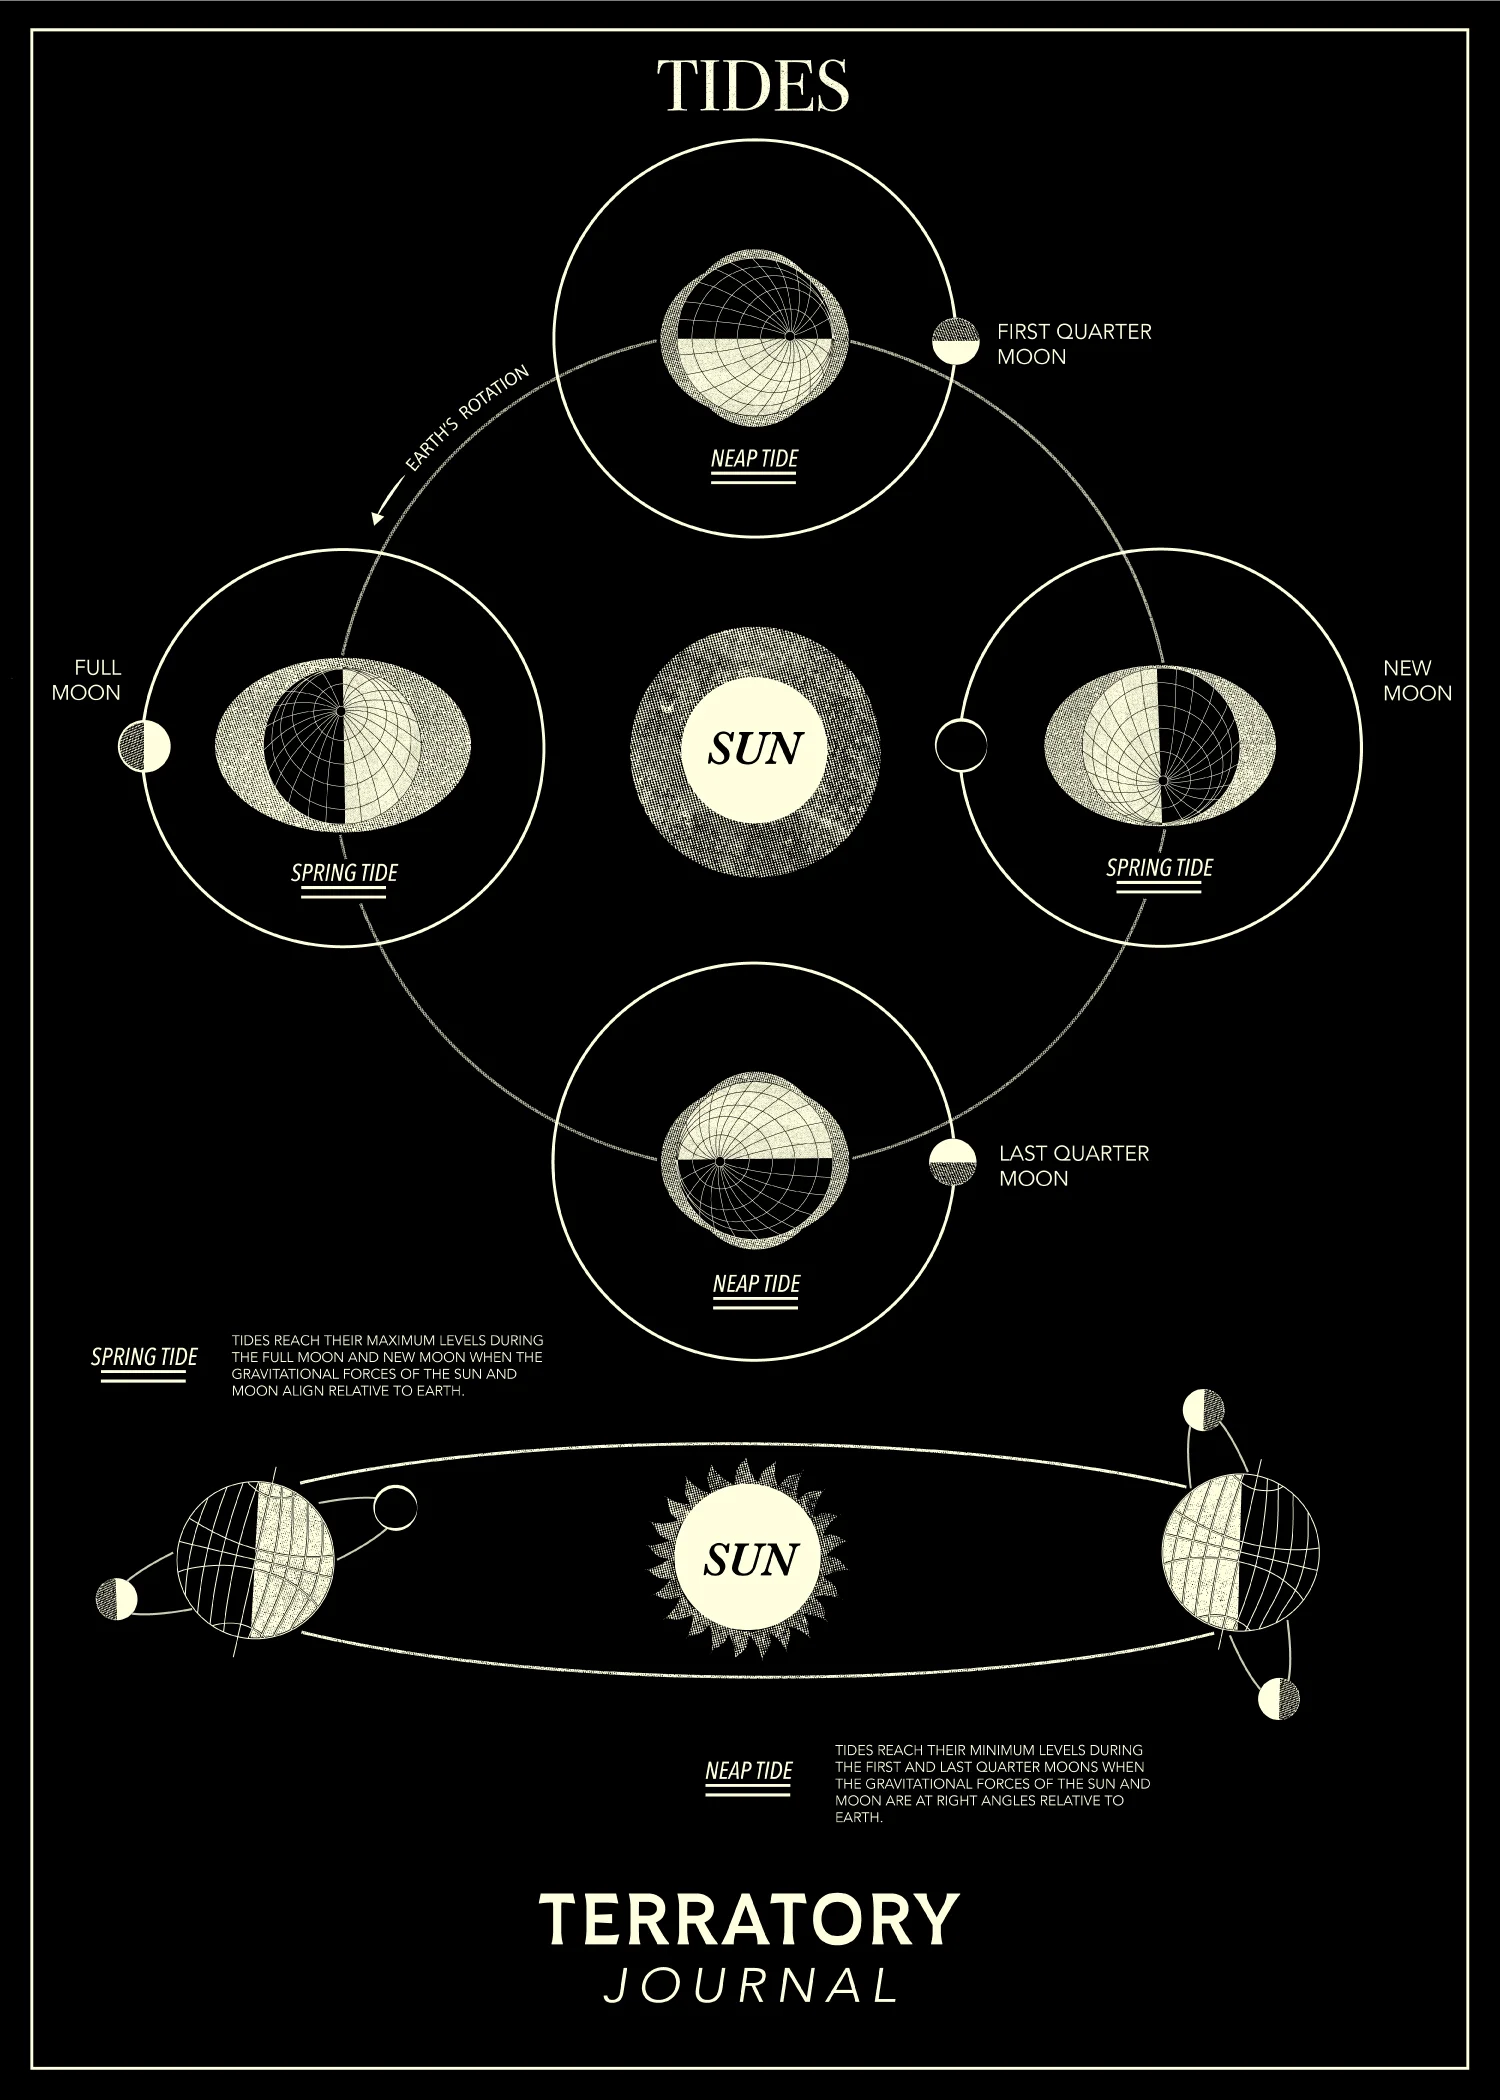
The separate sets of ocean tides related to the moon and sun act at times together and at other times in opposition. About every two weeks, the positions of the Sun, Moon, and Earth form a straight line. This occurs during the New and Full Moon Phases as viewed from Earth (see Full Moon and New Moon positions on the diagram). During this period, the lunar and solar related ocean swells line up and add up to produce tides having the greatest monthly tidal range (that is, the highest high tide and lowest low tide); these are called Spring Tides.
Between spring tides, at the first and third quarter phases of the moon, the sun's pull on Earth is at right angles to the pull of the moon. During this time, tides have their minimum monthly tidal range (that is, unusually low high tide and unusually high low tide); these are called Neap Tides or Fortnightly Tides. Furthermore, the moon orbits Earth in an ellipse (rather than a circle) so that the moon is closest to Earth (stronger tide-generating force) at perigee and farthest from Earth (weaker tide-generating force) at apogee. The moon completes one perigee-apogee-perigee cycle once every 25.5 days.
Tidal Measurement Systems
The methods for the prediction and measurement of tide heights are classified as Harmonic and Non-Harmonic. Via the Harmonic method, all tidal actions exerted on the earth are combined into a composite tide using calculations from planetary (sun, moon, earth, etc.) motions and oscillations. This method is rooted in Exdoxas’s 356 B.C. discovery, which explains irregular motions of the planets mathematically and geometrically through combinations of uniform and succinct circular motions.
The other method is the Non-Harmonic method of tidal prediction, which is made by applying the moon's transit times to the mean height of the tide. This method of calculation is a summation of average conditions and various inequalities that arise due to changes in the phase of the moon and the declination and parallax of the moon and sun. Notably, this method of measurement is noted as a less complex method for computing tides; but it is also a less accurate method of tidal measurement.
Up to and including the year 1884, all tide predictions for the tide tables were computed by means of auxiliary tables and curves constructed from the composite results of tide observations at different ports. From 1885 to 1911, the predictions were generally made by means of the Ferrel Tide-Predicting machine. From 1912 to 1965, tidal predictions were made by means of the Coast and Geodetic Survey Tide-Predicting Machine No. 2. It should be known that without the use of a tide-predicting machine the Harmonic method of tide computation would involve too much labor to be of practical service. However, with such a machine, the Harmonic method has many advantages over the Non-Harmonic system of measurement.
Predicting machines were superseded in 1966 with the advent of digital electronic computers. Initially these computers were of the large main-frame type. In the late 1980s, mainframes were replaced by the growing sophistication of desktop computers. Desktop computers are now used exclusively by the National Ocean Service in making tidal predictions for standard ports in the United States.
Problems with Tidal Prediction
As noted, physicists have derived precise mathematical expressions to describe the gravitational effects of the Moon and the Sun on the Earth. In theory, therefore, it should be possible to make very precise predictions of the timing and size of all ocean tides. In fact, absolutely precise predictions are not possible because of the large number of factors that contribute to the tides at any one particular location. The shapes of various ocean basins are primary among these variables. The ocean floor is so irregular and complex that seawater does not behave in a simple and predictable manner. Other variables also complicate the situation; these include variations in the Earth's axial rotation and variations in Earth-Moon-Sun positioning; including variations in orbital distance and inclination. Estimates of tidal behavior are therefore still based primarily on previous tidal observations, continuous monitoring of coastal water levels and astronomical tables.
Tides Matter
For centuries, people who live in coastal areas or who look to the sea for their livelihood have been observing the tides and tidal currents. They have benefitted from their observations and practical knowledge of tides in a variety of ways. For example, tidal knowledge has improved the safe navigation of ships to and from port. Prior to the development of motorized vessels, this navigational skill helped fuel exploration, maritime shipping and military activities at sea. However, most of all, tidal knowledge has helped in maintaining aquaculture and fishery related activities in the inter-tidal zones near our shores. Thus, the vitality of a days catch and the widespread availability of marine based foods has benefited dramatically from our knowledge of tidal patterns.
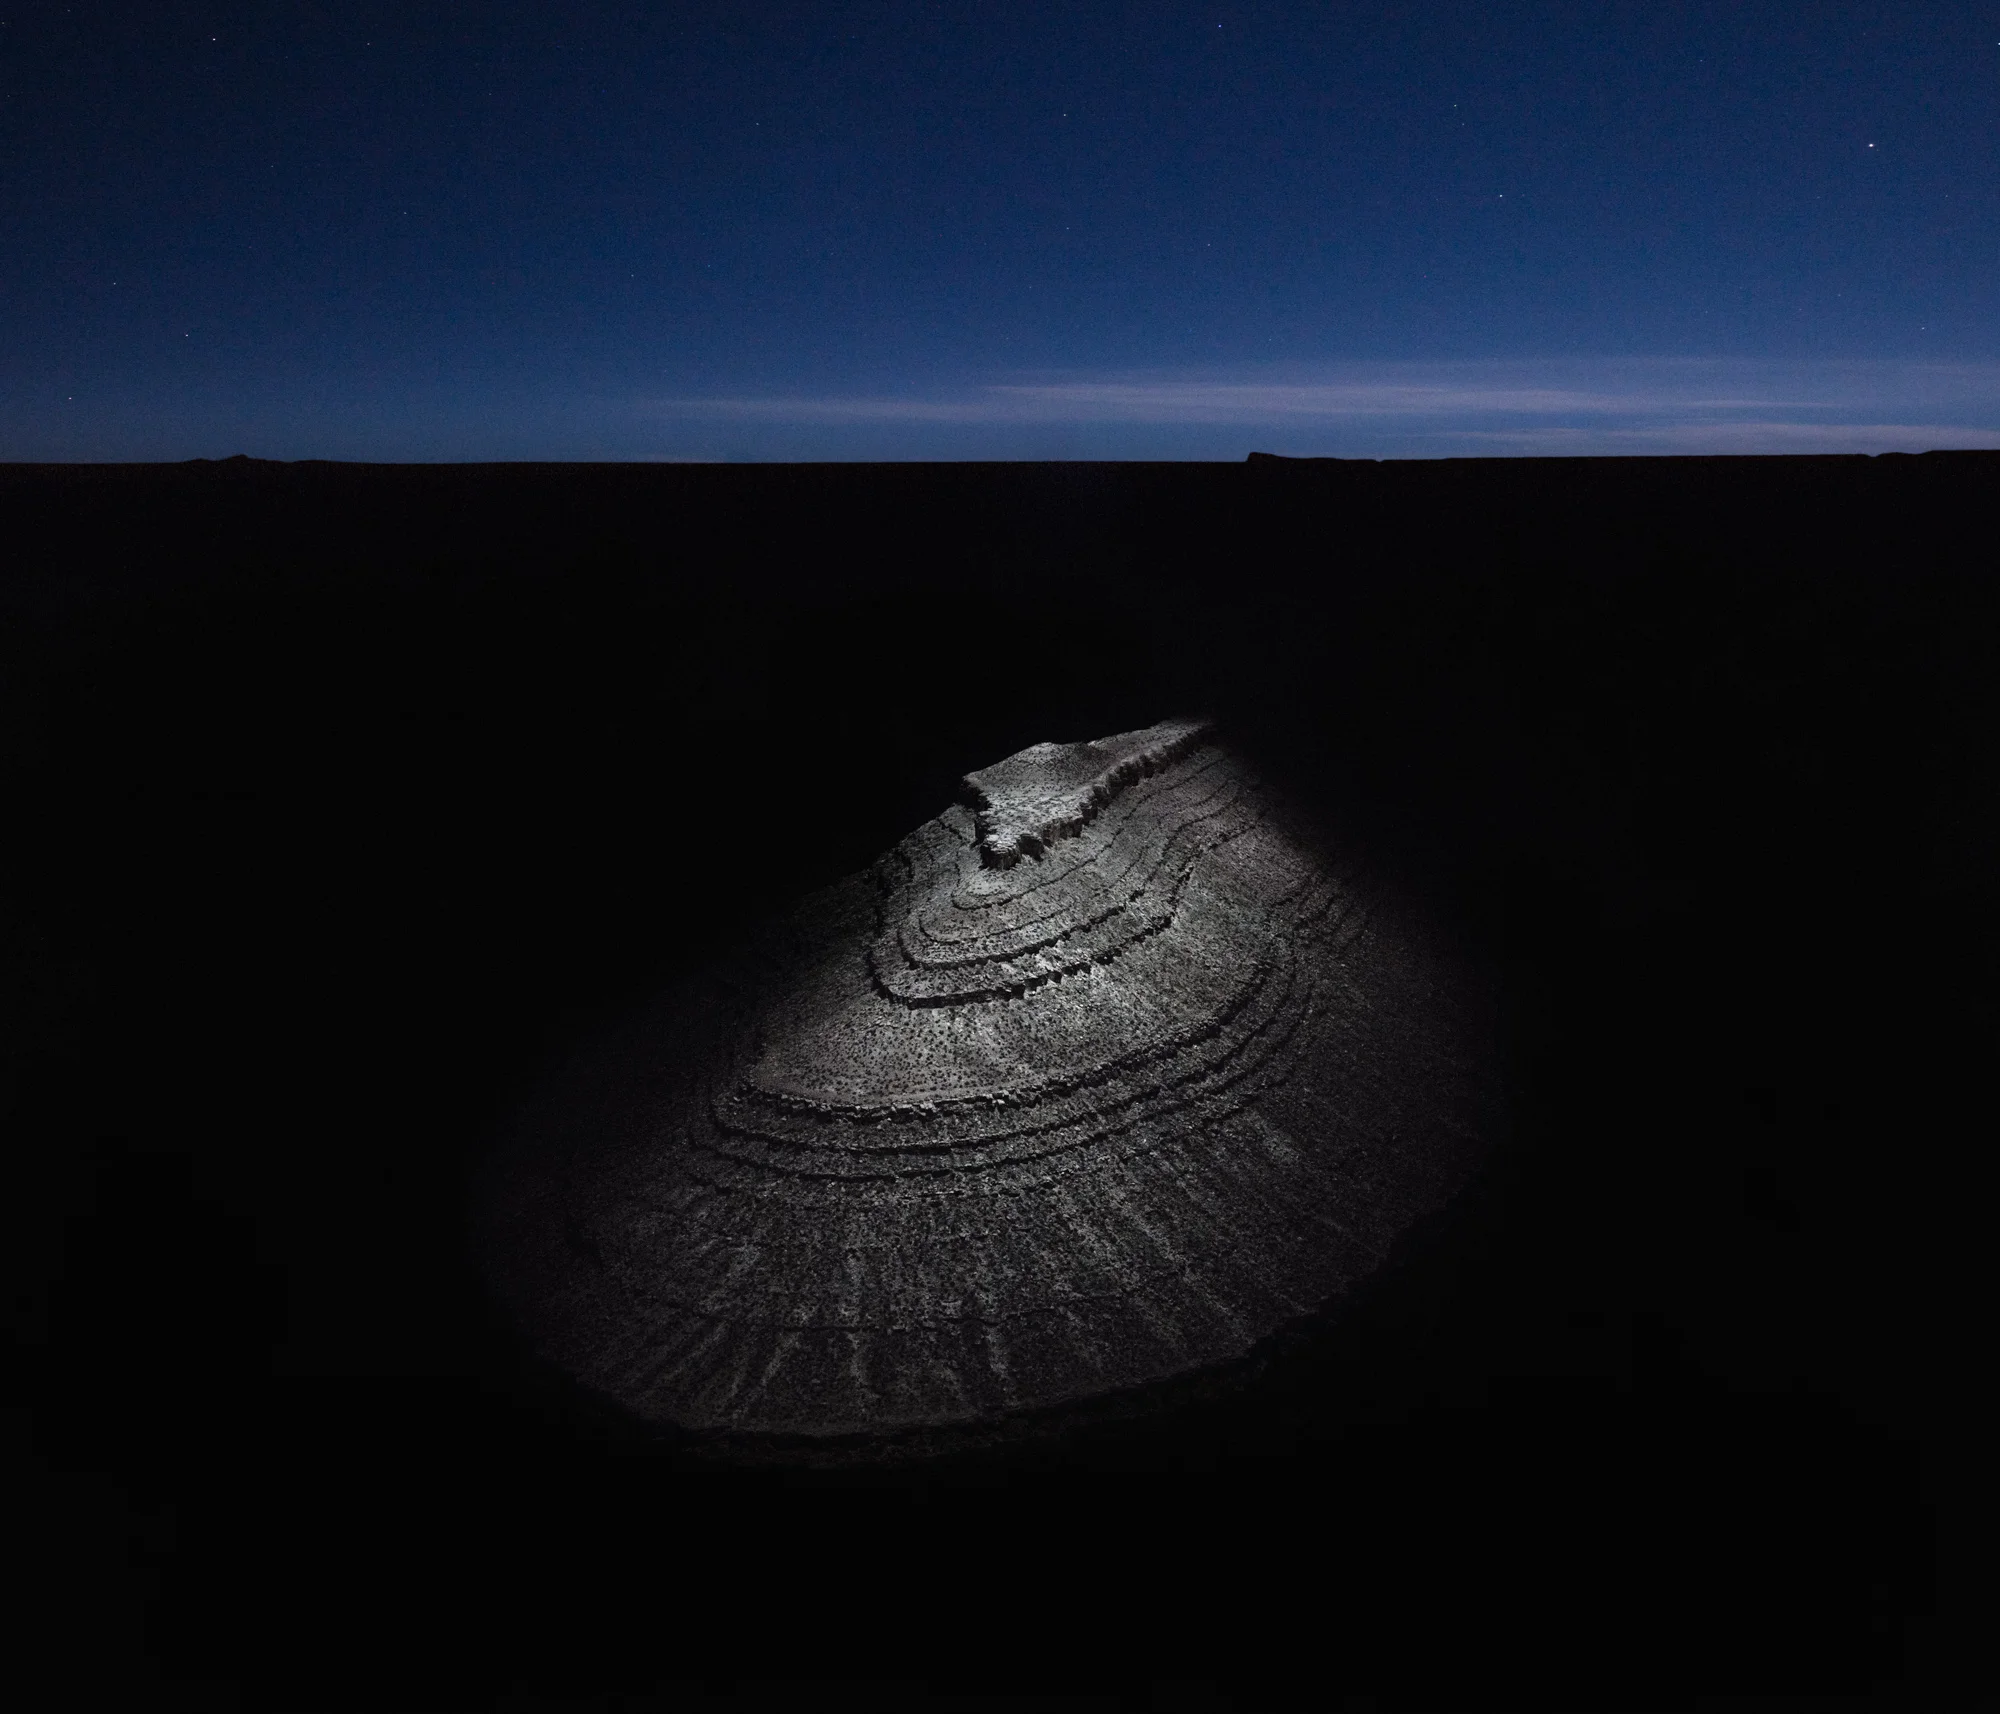
The Intertidal zone is defined as the area between the high tide and low tide mark. This is the spot where land based habitats and humans often interact with the sea. It is also the place where many integral ocean species such as bi-valves (oysters, mussels, clams, etc.) make their home. Thus, the health of the ocean is highly dependent on the intertidal zone and consequently human health also fits neatly into this picture. The thing to know is that the intertidal zone is currently being subjected to unprecedented and accelerated ecosystem stressors; such as ocean acidification, temperature changes in the water and overall sea level rise. The latter, has produced a sizable and permanent affect on human populations that reside near shorelines and within intertidal zones.
Core samples, tide gauge readings and most recently, satellite measurements, tell us that over the past century, the Global Mean Sea Level (GMSL) has risen by 4 to 8 inches (10 to 20 centimeters). However, the annual rate of rise over the past 20 years has been 0.13 inches (3.2 millimeters) a year, roughly twice the average speed of the preceding 80 years. Climate change models project that global sea-level rise will accelerate in the 21st century. Models based on thermal expansion and ice melt estimate that global sea levels will rise approximately 20 to 39 inches by the end of the century. However, due to uncertainties about the response of ice sheets to warmer temperatures and future emissions of greenhouse gases, higher values are possible and cannot be excluded.
When sea levels rise rapidly, small increases in the volume of ocean water can have dramatic and catastrophic effects on coastal habitats. As seawater reaches farther inland, it often causes destructive erosion, flooding of wetlands, contamination of aquifers and agricultural soils and lost habitat for fish, birds, and plants. Furthermore, when ocean charged storms hit land, heightened sea levels mean larger and more powerful storm surges that become highly destructive to human habitats near the coastline.
The fact of the matter is that hundreds of millions of global residents currently reside in areas that will become increasingly vulnerable to flooding. In some cases, higher sea levels will force residents to abandon their homes and relocate. Based on modeling and some predications, many low-lying islands could be submerged completely in the very near future. This is an interesting thing to ponder given the fact that so many global residents live near the ocean. In the United States, counties directly on the shoreline constitute less than 10 percent of the total land area (not including Alaska), but account for 39 percent of the total population. From 1970 to 2010, the population of these counties increased by almost 40% and they are projected to increase by an additional 10 million people or 8% by 2020. Currently, the population density of U.S. coastal shoreline counties is over six times greater than the corresponding inland counties. Could it be that the current trends of coastal settlement and the relevant coastal migration patterns will be challenged as we head into a new millennium of unpredictable and rising seas?
References: